Our latest update brings Ordnance Survey’s National Geographic Database (NGD) Buildings data into the software.
Not only are we feeding the data in once a month, we’re also producing on-the-fly analysis of the data to help you get the most out of this vast and in-depth database.
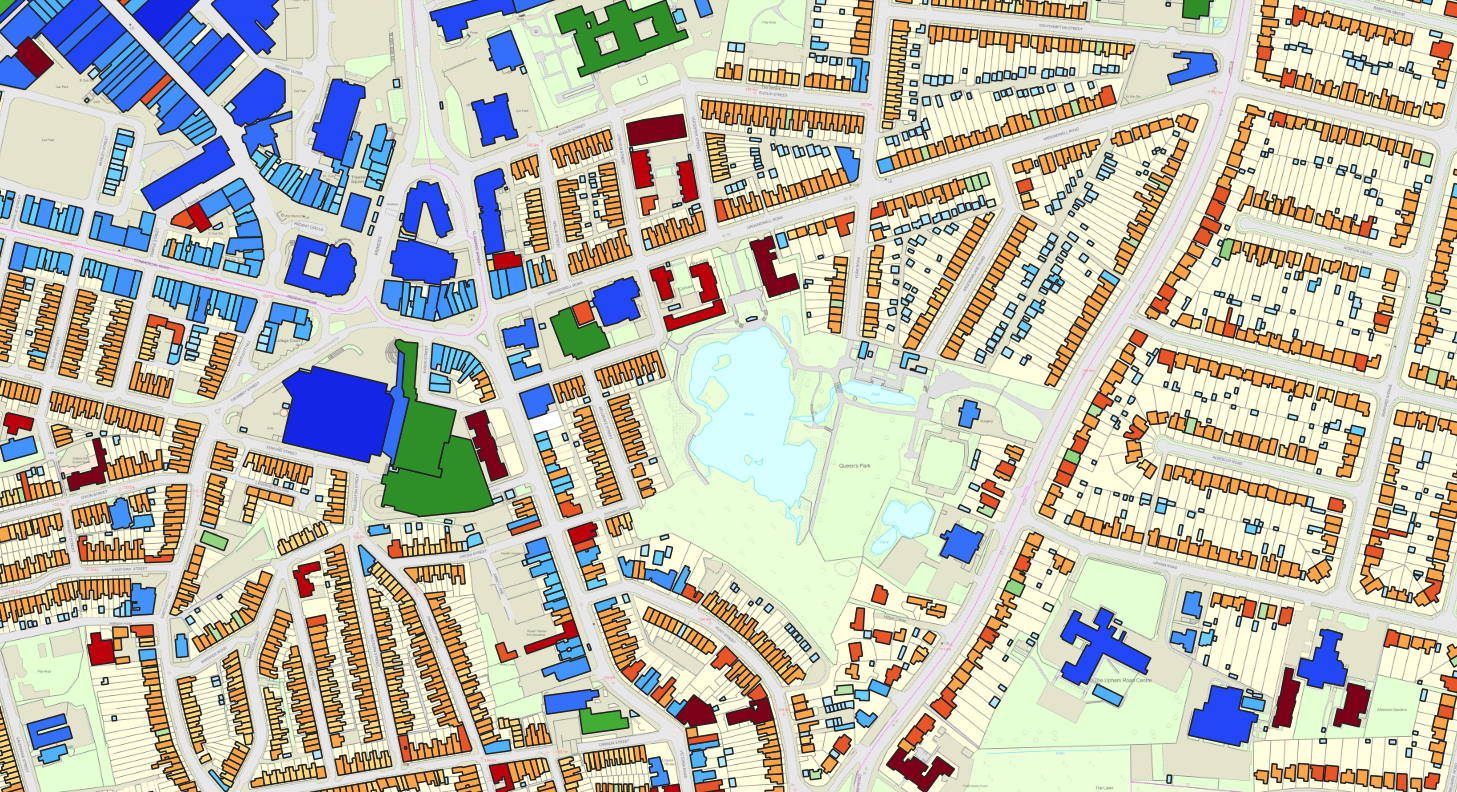
We’ve taken the information stored within each building outline and used it to tell a story. You can see:
- Recent Changes – only shows buildings that have had updates in the last 3 months
- Solar Potential – the solar potential for residential and commercial buildings
- Number of Floors – visualising the number of floors and highlighting buildings that have higher risk.
You can find out more by reading our Knowledge Base article or watching the video below. And, you can explore the data yourself by logging into your Parish Online or XMAP account.
This is just another way that we’re helping you use mapping data in an easy and intuitive way.