
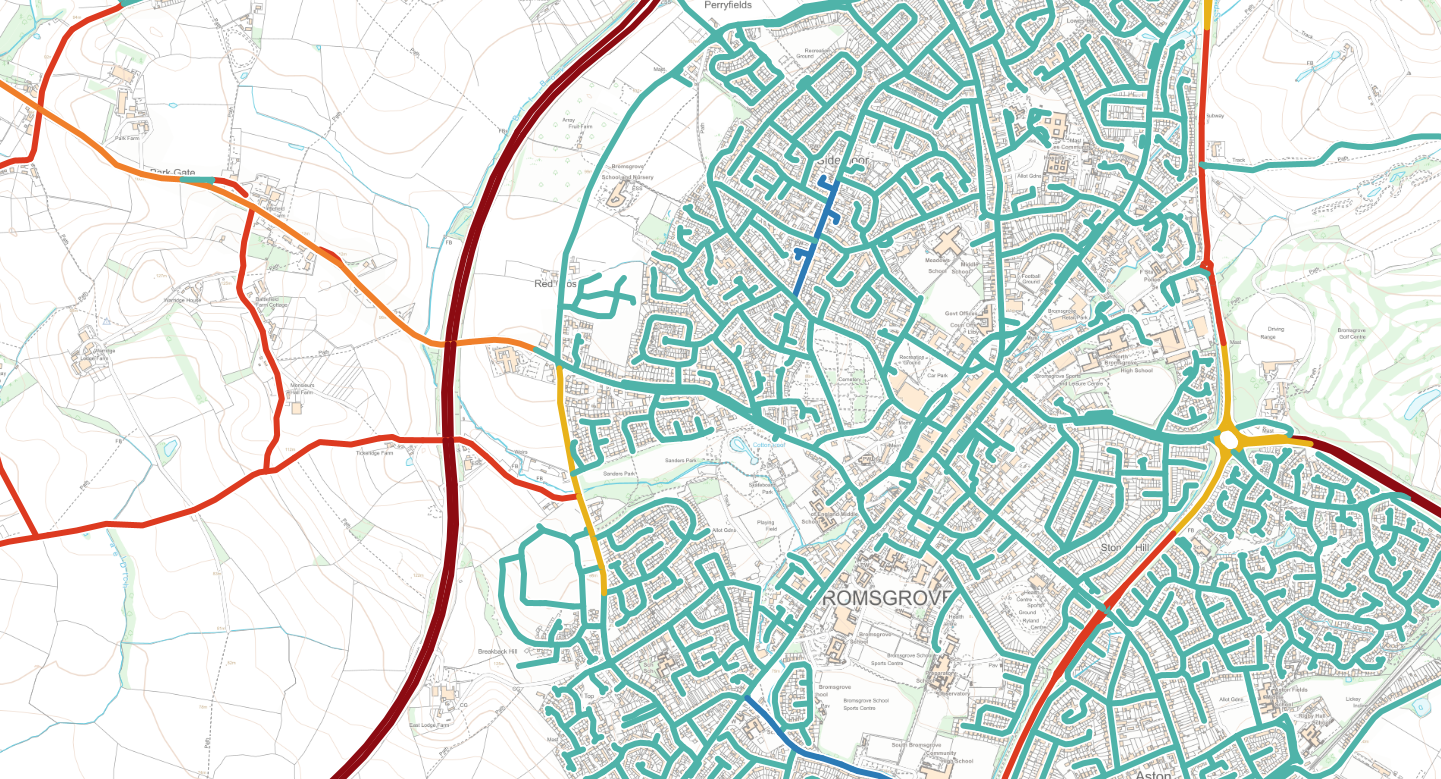
We’re leading the way with our roll-out of Ordnance Survey’s National Geographic Database (NGD) across all our products. We want to make sure that our customers not only get access to the data quickly, but we also want them to benefit from our analysis and additional styling we apply to make the data come to life.
Summary
In this release, we’ve published the NGD Transport theme which includes road speed limits, average speeds, bus lanes and cycle lanes. You’ll find the data in the “Ordnance Survey NGD” collection in your account. Our update cycle is matched to the Ordnance Survey release schedule, so you’ll always see the most up-to-date information.
The exciting bits
When initially glancing at the published data, it’s hard not to be underwhelmed by it (no offence Ordnance Survey!), but the revolutionary change with NGD is the data held within the points, lines and polygons. We picked through the data to find the most interesting bits and have published the data with styling to make the data really useful.

We’d recommend logging in and having a browse yourself, but the things that got us excited were:
- Much improved speed data stored within the road network. We’ve used this to style the roads based on their speed, giving you a clear picture of the different speed zones. Of course, there are still some anomalies (yes we know you can’t actually drive at 60mph through that caravan site) but overall it shows a much better picture. We’ve filtered out some of the oddities so you can view and print maps with high confidence.
- Granular speed averages for road sections that give you plenty to analyse. It’s got time-of-day, different direction, and weekday and weekend data. There’s a lot to trawl through, but this has the potential for some future analysis we have planned.
- Accurate widths for bus and cycle lanes. This means that rather than representing the lane as a line on the map that stays the same size no matter the zoom level, we can display the true-life width of the lane on the map. This brings the street-scene to life and can assist when there’s discussions on making public transport or active travel improvements.
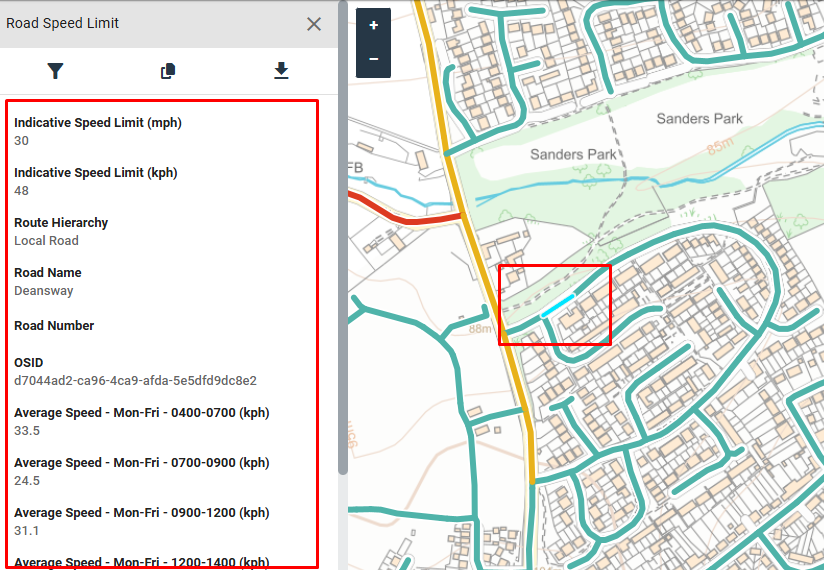
Over to you
The more thought and design we can put into the publishing of this data, the better it is for our thousands of daily users. If you have suggestions on what you’d like to see us do with this data, don’t hesitate to contact us, there are no wrong answers! If it can help you with your day-to-day tasks then that’s just another way XMAP and Parish Online and its wealth of data is providing real value.
To find out more about the styling for these layers, check out our Knowledge Base.
Geoxphere provides XMAP to businesses and Local Government, and Parish Online to the most local tier of Government; Town, Parish and Community Councils. We are an Ordnance Survey partner and hold national PSGA datasets on behalf of our customers.
Free, fully featured trial accounts are available for both XMAP and Parish Online.